Dynamic graphing
The way graphing should be
Cloud-based dynamic graphing brings your data, visuals, and reporting into one connected workflow.
Visualise, interpret, and communicate complex geotechnical data in ways that static charts simply cannot. Geotechnical decisions can change fast. Your graphs should too. Always current, clearly standardised, and easy to share. Dynamic graphing replaces disconnected spreadsheets with a single source of truth that updates automatically as new lab, field, and monitoring data arrives. It helps you explain ground conditions clearly, because the story updates with the data.

Always up-to-date
Live links to your data reduce rework and the risk of reporting from outdated exports.

Consistent outputs
Templates and shared styles help teams produce graphs that match project and company standards.

Built for collaboration
Cloud access makes it easier for multiple contributors to review, iterate, and approve.
Dynamic graphing that keeps pace with your data
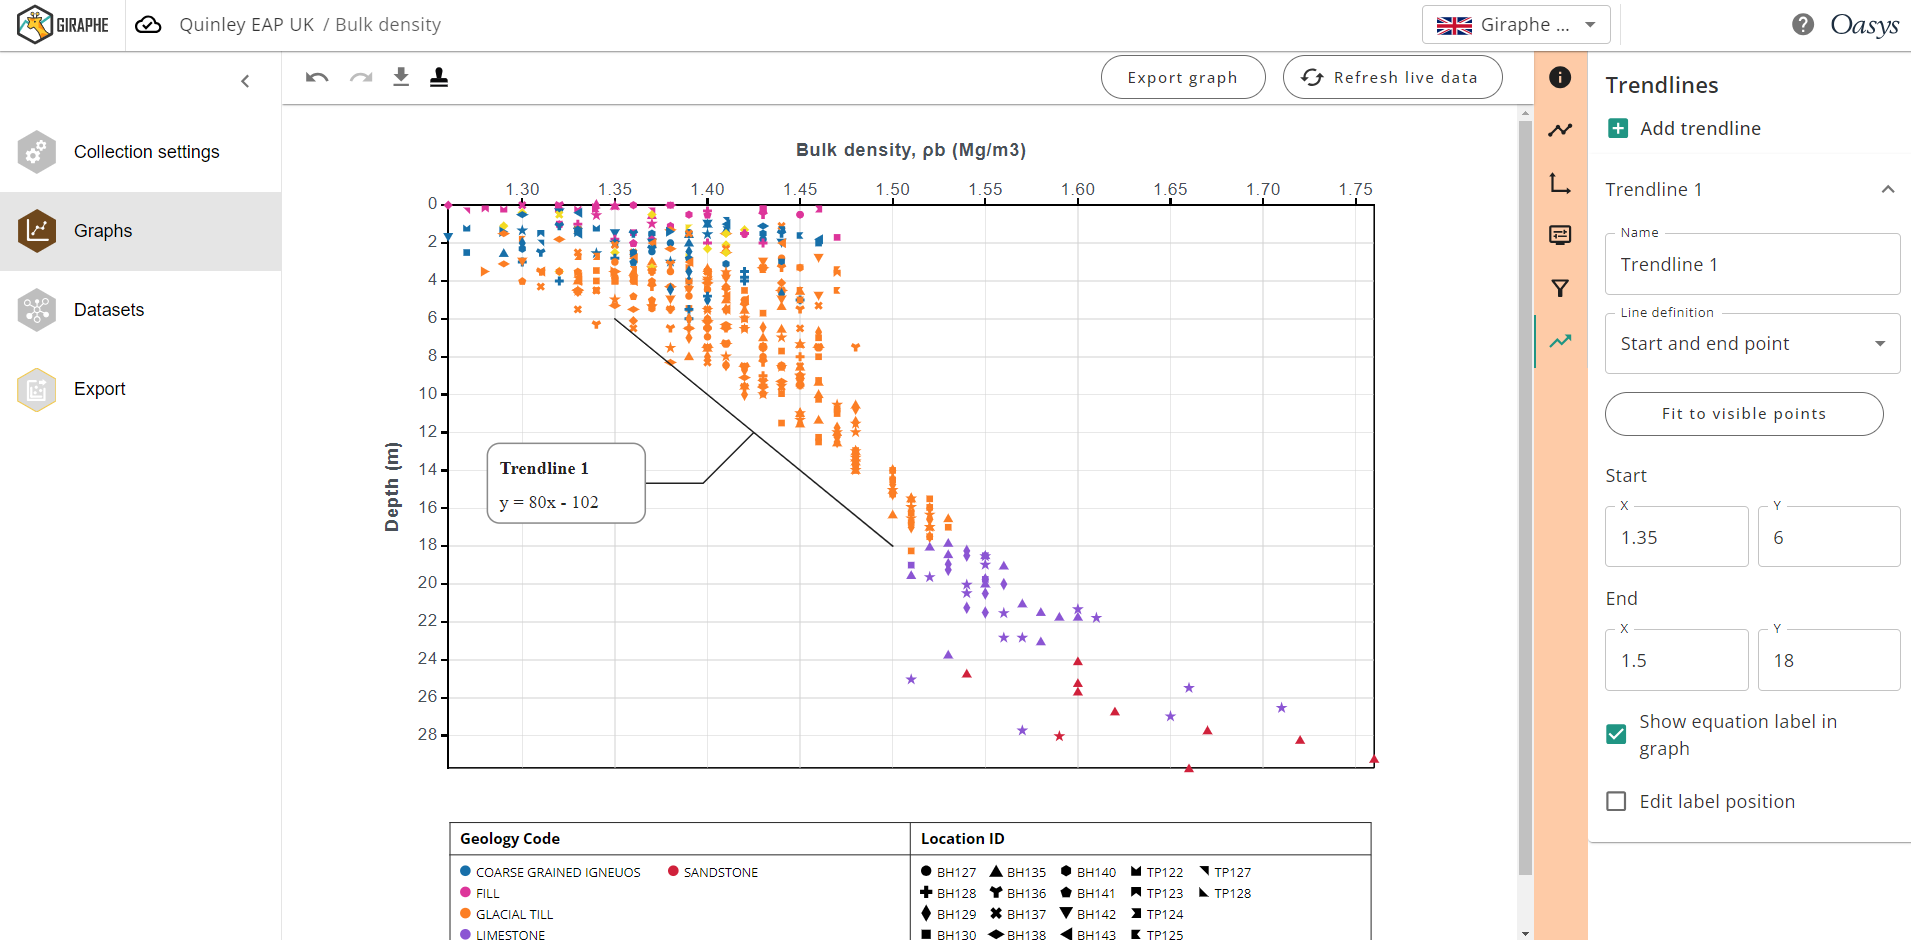
Oasys Giraphe is a cloud-based geotechnical dynamic graphing software, designed specifically for geotechnical engineering workflows. Developed in partnership with Seequent, Giraphe connects directly to OpenGround geotechnical information management solution and other data sources to create live, flexible graphs that support clearer reporting.

Ready to move beyond static charts?
If you’re relying on spreadsheets and exported images for geotechnical reporting, dynamic cloud-based graphing is a practical next step. Giraphe is designed for geotechnical workflows, helping teams produce consistent, always-current graphs directly from their data. Get in touch to learn more.